
The duck curve / landlord edition
Don't buy a discount
on power you cannot use.
Some PPAs generate impressive forecasts without fully explaining simultaneous site demand, export or curtailment, payment terms, tenant recovery and residual grid charges. We test the real economics.
Understand the curve
Solar follows sunlight. A shopping centre follows trading activity.
The classic duck curve shows net grid demand after solar production: a midday dip and steep ramp as solar fades. A centre needs its own version—measured site demand minus its generation at the same time interval.
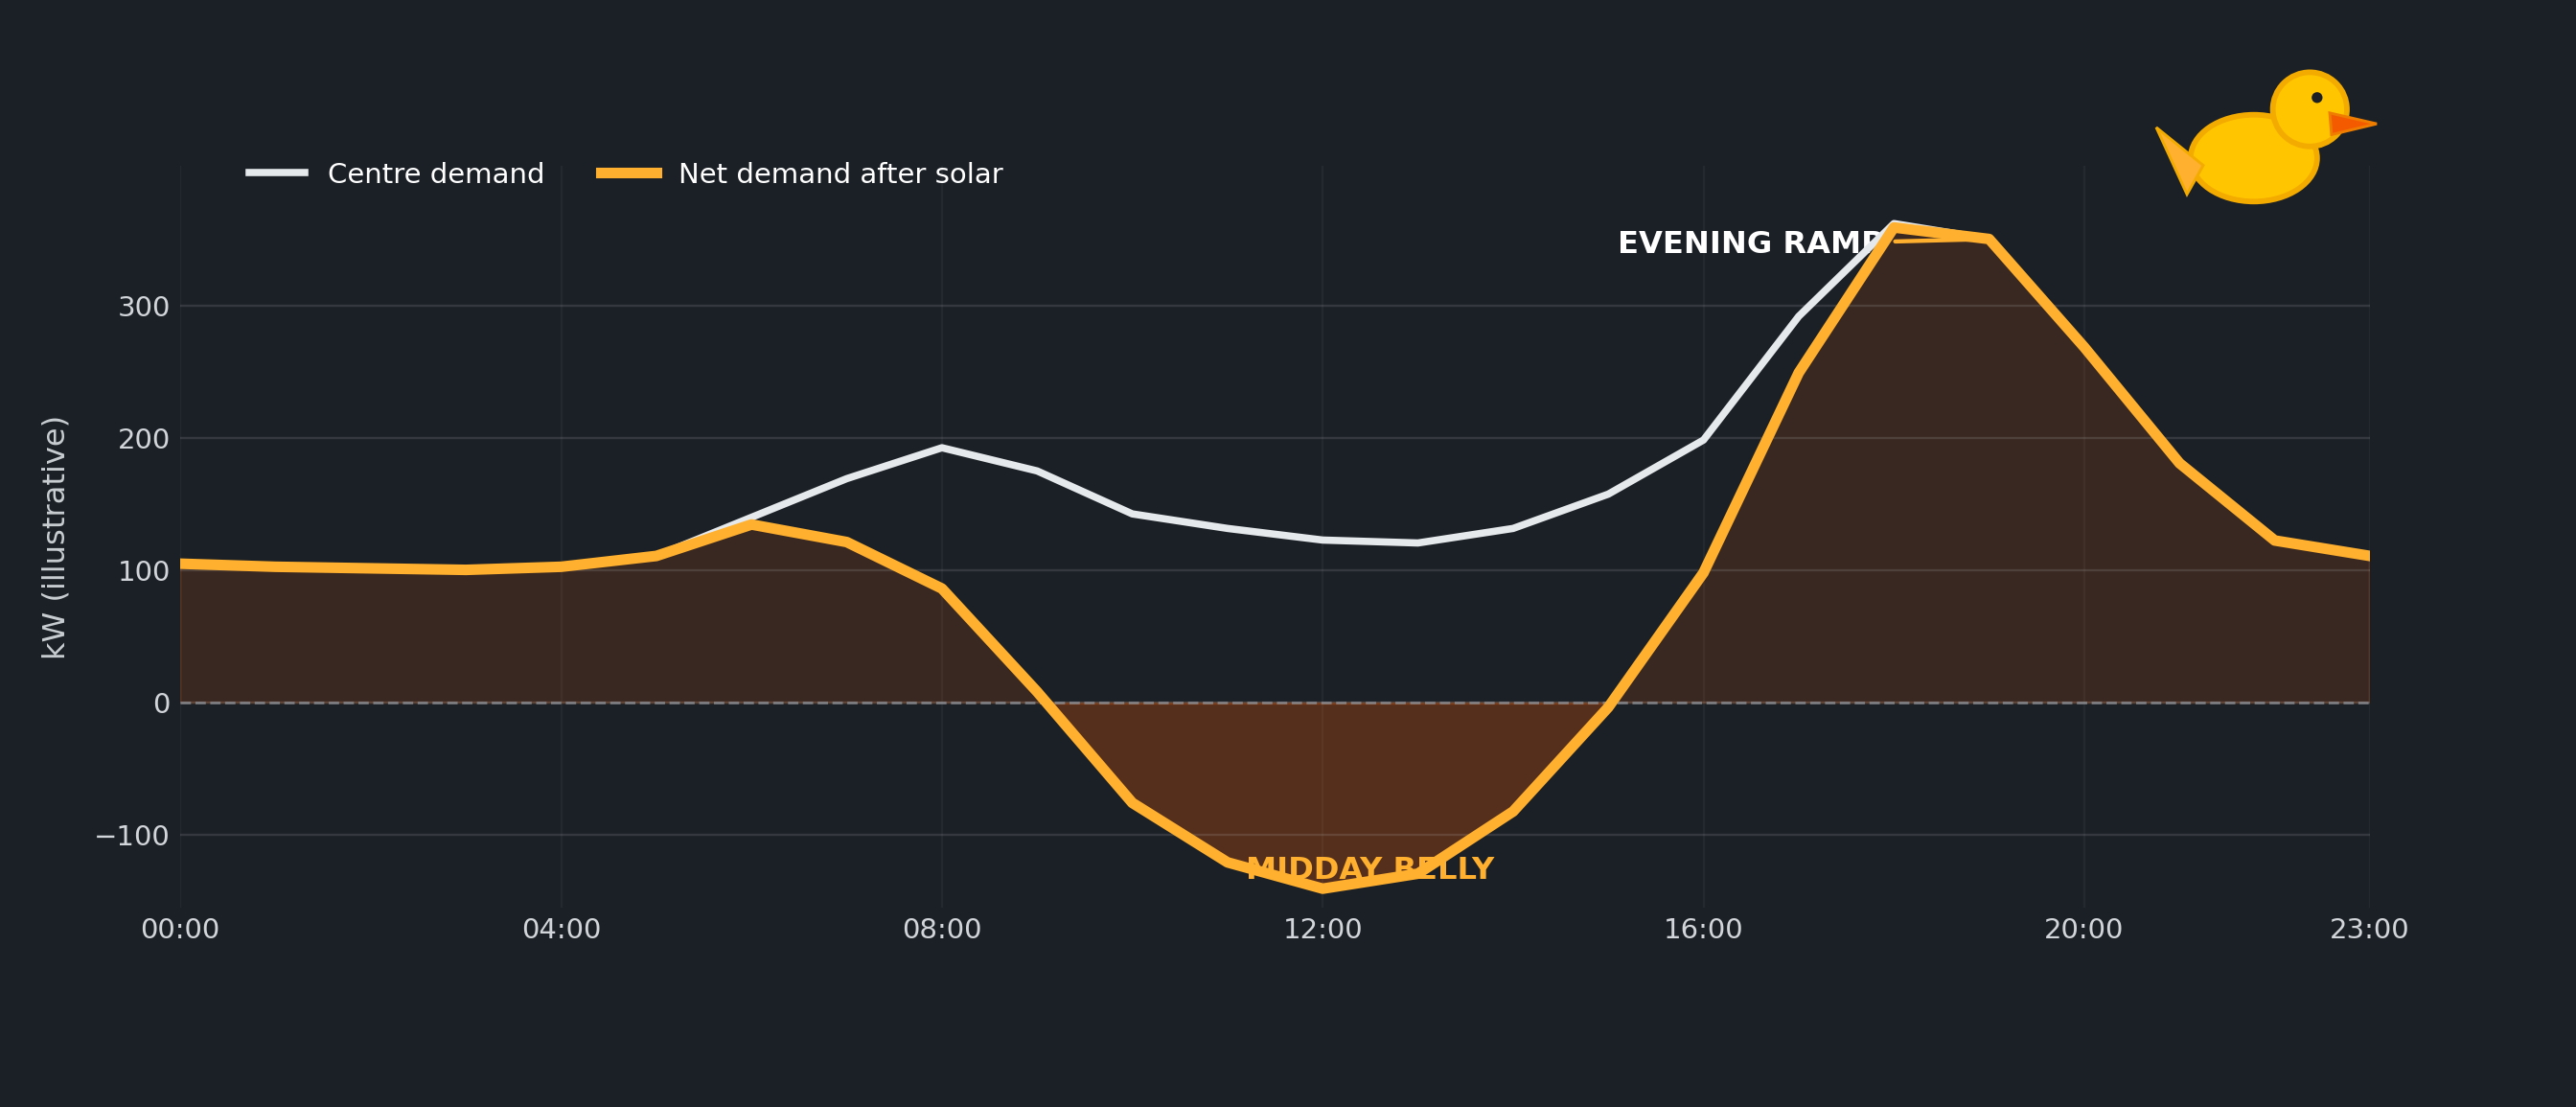
Morning
Operations and refrigeration load can begin before solar output is meaningful.
Midday
Solar supply rises; any output beyond instant demand needs a technical or commercial solution.
Late afternoon
PV generation falls while some tenant and centre loads remain strong.
Evening
Restaurants, lighting and other trading loads may continue after sunset.
Illustrative 5,000 m² scenario
The difference between generation and usable savings.
Assume a shopping centre uses 120,000 kWh in a month. A rooftop PV system generates 55,000 kWh, but only 38,500 kWh (70%) coincides with on-site demand. The remaining 16,500 kWh has no export credit in this example.
| Monthly assumption | Illustrative value |
|---|---|
| Centre electricity consumed | 120,000 kWh |
| Solar energy generated | 55,000 kWh |
| Solar used simultaneously | 38,500 kWh |
| Energy not used on site | 16,500 kWh |
| Grid energy price avoided | R2.50/kWh |
| PPA charge | R1.60/kWh |
| Headline saving if every generated kWh were usable | R49,500 |
| Actual grid energy purchases avoided | R96,250 |
| PPA payment if billed on all generation (55,000 x R1.60) | R88,000 |
| Net energy-cost saving under this take-or-pay example | R8,250 |
The table is hypothetical, assumes billing for all generated kWh, no export credit and no battery shifting, and excludes demand/fixed charges, taxes and tenant recoveries. In a pay-for-consumed-only PPA, savings would differ materially. Not all PPAs charge for unused generation.
The relevant question is not “How much can the array generate?” It is “What power can this property use or monetise, under what contractual terms, and who keeps the benefit?”
Seven questions before a 20-year PPA
Demand a complete landlord model.
1–4 / Engineering and billing
- What does the site's 15- or 30-minute measured load profile show?
- What fraction of generation is consumed, stored, exported or curtailed?
- Is payment based on generated, delivered, consumed, deemed or minimum contracted energy?
- Which demand, network, capacity and fixed charges remain?
5–7 / Landlord economics
- How are lawful tenant recoveries, tariff constraints and utility reconciliation affected?
- What happens if occupancy, anchor tenants, tariffs or operating hours change?
- What alternative outcomes are available through roof rental, managed services, BESS or hybrid structures?
Lightpath's position: We are not opposed to PPAs. A PPA is appropriate when generation matches useful load, commercial terms allocate risk fairly and the landlord can demonstrate the retained benefit. We reject shortcuts that substitute a kWh discount for complete property economics.
The property first. Energy second.
Find out what your property's energy should be worth.
Start with an assessment of your roof, utility accounts, tenant recovery structure, consumption patterns and operating objectives.